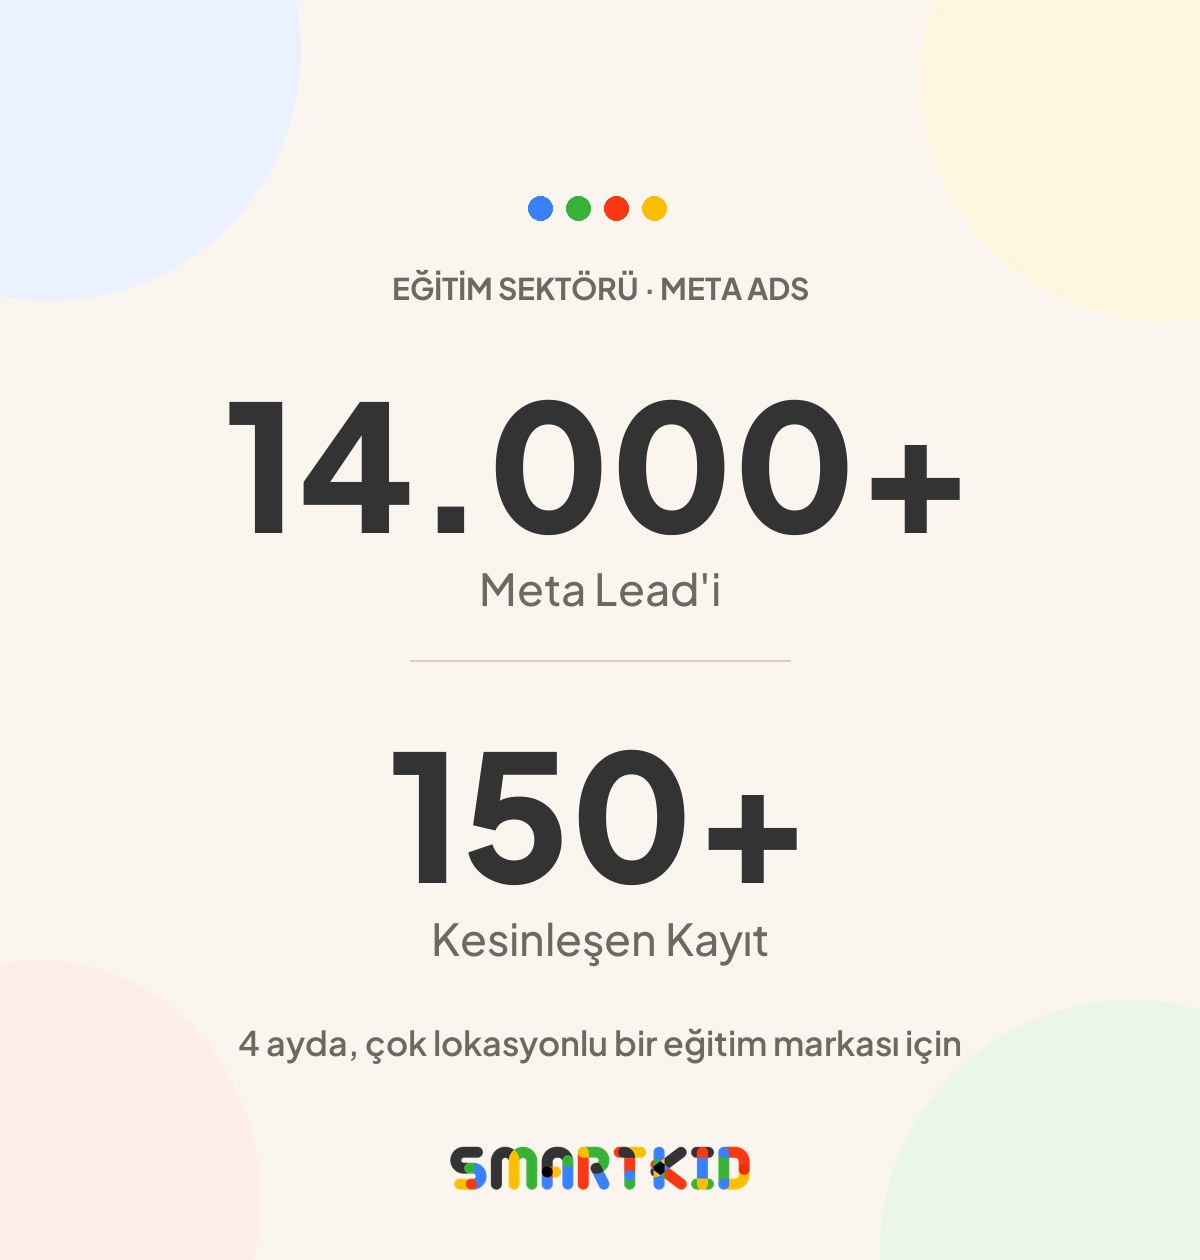
14,000 leads sounds good.
But let's be honest: for an education brand, a form count on its own means nothing. Seeing thousands of leads in an ad dashboard is easy. The real question is how many of those leads picked up the phone, spoke with a campus, and finally enrolled.
That is exactly what we focused on in this project.
A four-month Meta advertising engagement for a multi-location education brand produced more than 14,000 leads and over 150 confirmed enrollments.
And we did not get there by opening one campaign and pushing the budget up. We built a student acquisition system that handled each location's competitive conditions, parent profile and demand potential separately.
Client confidentiality means we do not disclose the institution's name, its campuses, its cities, its ad budget or its commercial data. What we can share in full is the method we used and the performance results that can be made public.
The results, up front
The publicly shareable results from the four-month active campaign period:
- More than 14,000 Meta leads
- More than 150 confirmed student enrollments
- A verified lead → enrollment rate above 1%
- An average Meta cost per lead below 250 TL
- A media CAC below 24,000 TL
- First-enrollment value / Meta spend above 20x
- Estimated student LTV / Meta spend above 100x
These are not estimated form-fill counts. The lead figures come from Meta Ads Manager data, and the enrollment figure comes from aggregated sales data verified by the institution.
The actual enrollment total has not been disclosed in full, for reasons of commercial confidentiality. Only the lower bound that is safe to share is used here.
The goal was never "more leads"
When we started the project, we were not looking at one school or one audience.
There were multiple locations, parent profiles that differed from one another, and competitive conditions that changed from region to region. Targeting that worked at one campus did not deliver the same result at another. In some regions high volume was easy to reach; in others, the same volume demanded far higher cost.
So we did not pile every campus into a single ad set and wait for the algorithm to work a miracle.
We split the campaign structure by location, audience density and demand profile. Broad audiences and audiences carrying a stronger value signal did not go into the same basket. Meta Lead Ads, landing pages and different campaign models were each evaluated on their own.
Because in education, not every lead is the same.
One parent may fill out a form only to find out the price. Another may plan a campus visit that same week. Both show up as a single lead in the Meta dashboard, yet their commercial value is not the same.
That is why we did not look at the form count and declare victory.
How we built the campaign architecture
We built the work on five core principles.
1. We separated the locations
Every location had its own competition, its own reachable audience and its own parent profile. So budget and performance were assessed location by location.
That way, the result of a region performing well did not disappear inside the cost of a region running expensive.
2. We tested volume and value goals separately
Some campaigns focused on reachable parent volume, others on audiences carrying a stronger value signal.
That split showed us not only which targeting brought cheaper leads, but also how far each audience strategy could scale.
3. We did not commit to a single conversion method
We tested Meta's own lead forms and website- and landing-page-based conversion models separately.
Each model had a different advantage. Lead forms produced volume quickly, while landing-page campaigns created a different kind of user behavior. We did not judge the two systems against the same performance expectation.
4. We scaled the winners in a controlled way
Campaigns that started producing high volume were not blown up overnight with uncontrolled budget. We built new variations and tracked how scale affected cost per lead.
In the end, most of the total leads came from the core campaign clusters running below the overall average cost.
5. We read every campaign alongside its sales result
A cheap lead is not always a good lead. An expensive lead is not always a bad one.
Every campaign in this project produced sales. So we did not run the evaluation by looking at a CPL table alone. Lead volume, cost and confirmed enrollments were treated as parts of the same picture.
Where the biggest volume came from
More than half of total lead volume came from four core campaign clusters.
The combined cost per lead across those four clusters landed at roughly 200 TL. Put differently, the campaign's real scale came not from the structures spending the most, but from the ones that could hold cost and volume in balance.
In the most efficient large campaign clusters, cost per lead fell to a range of roughly 109–200 TL.
In some locations, by contrast, CPL climbed sharply. That gap reminded us of something important:
In multi-location education advertising, a single "average CPL" does not tell the whole truth.
Even within the same brand, the same offer and the same period, costs can differ several times over between locations.
How we looked at lead-to-enrollment
Measured against the publicly shareable lower bound, each enrollment took fewer than 96 Meta leads on average.
Because the actual enrollment total sits above that lower bound, the real media CAC is lower than the 24,000 TL ceiling we publish.
At this point, cost per enrollment has to be read together with the economic value of a student.
Taking the average first-enrollment value reported by the institution and the estimated student lifetime value into account:
- First-enrollment value exceeded 20x Meta spend.
- Estimated lifetime value exceeded 100x Meta spend.
These are not net profit ratios. They show the relationship between the gross enrollment value produced and Meta media spend.
Agency fees, the sales team, operations, taxes, discounts, collections and other institutional costs are not included in the calculation.
The most important thing we learned from this project
Good ad management in education is not the business of collecting cheap forms.
The real performance chain looks like this:
Ad spend → lead → conversation → campus visit → confirmed enrollment → student lifetime value
If you measure only the first two steps of that chain, you may be managing an ad account; you are not managing a student acquisition system.
14,000 leads was a striking result for us. But the real value was that the volume found an answer on the sales side.
A campaign whose form count never turns into enrollments will not create growth, however cheap it looks. A lead that reaches the right parent audience, can be worked by the sales team and converts into an enrollment is what creates real commercial value.
How the results were calculated
The analysis used Meta Ads Manager campaign outputs together with enrollment data verified in aggregate by the institution.
Calculation method:
- Average CPL: total Meta spend / total Meta leads
- Lead → enrollment rate: disclosed minimum enrollment count / total leads
- Media CAC ceiling: total Meta spend / disclosed minimum enrollment count
- First-enrollment value ratio: disclosed minimum total enrollment value / Meta spend
- Estimated LTV ratio: disclosed minimum student lifetime value / Meta spend
Campus and city results have been merged to keep the client from being identified. The enrollment count is likewise shared as a safe, publicly disclosable lower bound rather than the full actual total.
Do Meta ads really bring enrollments in the education sector?
Yes. With the right campaign architecture and a sales process that actually works, Meta ads can produce real enrollments for education institutions.
But opening a lead form is not enough on its own. Location structure, parent profile, creative message, form experience, campaign budget and the sales team's response speed all have to work together.
In this project, more than 14,000 leads came through Meta and the verified enrollment count passed 150.
What is a good CPL in education advertising, in TL?
There is no single answer that holds for every institution.
In this project, cost per lead in the large, efficient campaign clusters landed in a range of roughly 109–200 TL, while in some locations it climbed to far higher levels.
CPL shifts with city, competition, enrollment season, the school's price level, brand awareness, the target audience and the conversion model in use.
That is why, before asking "Is the lead cheap?", you should be asking "Does this lead turn into an enrollment?"
Why do we not disclose the client's name?
In education, ad budget, enrollment counts, student value and campus performance can all qualify as trade secrets.
That is why the case study does not publish the brand, city, campus, budget or full sales data that could identify the client. We share the results anonymously, in aggregate, and through conservative lower bounds.
Closing thought
This case showed us one thing again:
Growth is not the green numbers in an ad dashboard.
Real growth is finding the right parent, routing that demand to the right campus, building a lead flow the sales team can actually work, and measuring the ad investment against confirmed enrollments.
When Smartkid runs campaigns in education, we do not only ask "How many leads came in?"
The question we really ask is this:
How many real students did this ad investment win for the institution?
The approach we used in this case: Meta Ads Management. A roadmap built for you in 15 minutes.