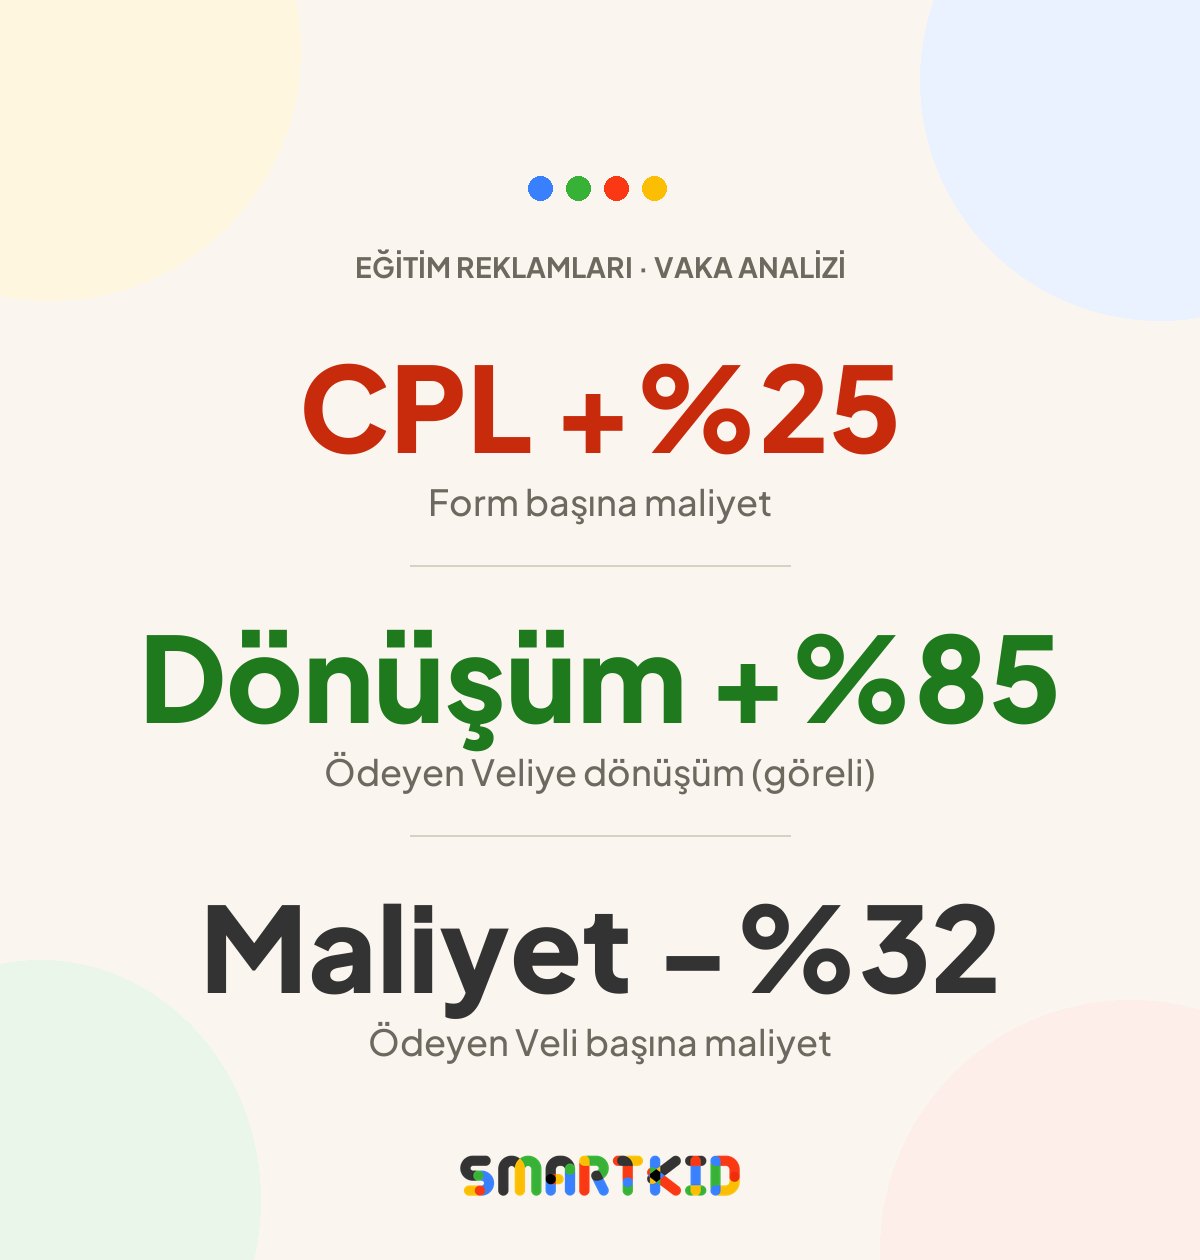
Everyone who opens an ads dashboard looks at the same number first: cost per form. Across our four education projects that number went up — from 295 TL to 368.75 TL. On a conventional report that reads as a step backward. For the sales team's cash register it was the best news of the period. Because the share of form fills that turned into a paying parent rose from 12% to 22.2%, and cost per Paying Parent — the outcome where institutions actually make money — fell by roughly 32%.
In this analysis a Paying Parent is not simply someone who fills in a form, takes a phone call or visits the campus. It is a parent who has completed payment to the institution. Throughout this article we measure commercial success with that metric.
Results at a Glance
| Metric | Before | New system | Change |
|---|---|---|---|
| Cost per form (CPL) | 295 TL | 368.75 TL | 25% increase |
| Form-to-Paying-Parent conversion | 12% | 22.2% | 85% relative increase |
| Cost per Paying Parent | ≈ 2,458 TL | ≈ 1,661 TL | ≈ 32.4% decrease |
Under the same media budget, these ratios correspond to roughly a 48% gain in Paying Parent efficiency — a mathematical inference made on the assumption that everything else stays equal, not an independent metric measured directly.
Data scope: This case analysis shows aggregated results from the first 10 days of four education projects. Raw form and payment counts are withheld for commercial confidentiality. The results represent early-period performance; they are not a guarantee of long-term performance.
The "Cheap Lead" Trap
The most common misreading in education advertising is treating a low cost per form in the dashboard as success. By "lead" here we mean the person who arrives from the ad and completes the application form — not yet a parent enrolled, just an inquiry.
If you make the form as frictionless as possible and strip it of context, inquiry volume rises and cost falls. But a significant share of those inquiries comes from price curiosity, mistaken expectations or a passing interest. The sales team calls more forms, spends more hours — and sees fewer payments. The marketing report looks bright; the cash register says otherwise.
The real measure is the chain that runs from the form to the Paying Parent. Until that chain is measured, CPL on its own is misleading.
Why We Deliberately Accepted a More Expensive Form
Our goal was not to collect as many forms as possible. The goal was to let the parent with high enrollment intent, a good fit with the institution and readiness to apply identify themselves.
The multi-step application structure did two jobs at once here: low-intent users dropped out naturally as the flow progressed, while genuinely interested parents were given a clear, controlled application experience rather than everything piled onto a single screen. A rise in cost per form is not a sign of failure; it can be the natural consequence of higher-intent inquiries.
The Standalone Multi-Step Form System
At a methodological level, the system can be summarized as follows:
- After the ad, the user moves to a standalone, distraction-free application experience.
- The experience is built mobile-first; parents mostly apply from a phone.
- Questions are not stacked all at once; they progress through a multi-step flow.
- The questions are adapted to the institution's admissions and enrollment process.
- The flow prompts the applicant to consider their own needs and their fit with the institution.
- A successful form completion is measured as a separate conversion event.
- The chain of ad, form and commercial outcome is evaluated as a whole.
What We Measured in Meta Optimization — and What We Did Not
Here is the confirmed implementation on this project: a successful form completion was counted as a conversion on the Meta side. Defining a successful form completion as the correct conversion event helps Meta optimize toward users who are more likely to complete the form.
The next level of maturity is feeding qualified inquiries and payment outcomes from the CRM back to the platform through the Conversions API. We are not presenting that second layer as something implemented within this case.
The Math: Check the Numbers Yourself
The formula is simple:
Cost per Paying Parent = Cost per form ÷ Form-to-Paying-Parent conversion rate
- Before: 295 TL ÷ 12% = 2,458.33 TL
- New system: 368.75 TL ÷ 22.2% = 1,661.04 TL
The result: while cost per form rose 25%, cost per Paying Parent fell by roughly 32.4%.
One detail worth noting: the absolute increase in conversion is 10.2 percentage points (12% → 22.2%); the relative increase is 85%. Saying "the conversion rate became 85%" would be wrong — the accurate statement is that form-to-Paying-Parent conversion rose from 12% to 22.2%.
Implementation Across Four Education Projects
This system was implemented in the standalone application experiences built for Algorithmics Ankara, ERA Kolejleri, Kadro Kurs and English Time. The published ratios are not individual brand results; they are aggregated first-10-day data from the four projects.
In all four projects the direction of movement was the same: cost per form rose, and form-to-Paying-Parent conversion strengthened. Crediting this to form design alone would be unfair — ad messaging, targeting, form flow, measurement and the enrollment team's follow-up are all parts of the same system. Results like these become possible when the structure built on the Meta ads management side works toward the same goal as the form experience.
Our other published work in the education sector follows the same principle: the case with 14,000+ Meta leads and 150+ verified enrollments covers the volume side, while the Koray Varol Okulları study covers premium parent targeting.
CPL or Cost per Paying Parent?
- CPL is an early indicator of media efficiency; it points the way in a campaign's first days.
- Cost per Paying Parent is the commercial outcome indicator; it is the only ratio that looks at the institution's cash register.
- Both should be tracked together; neither replaces the other.
- A rise in CPL is not bad news on its own.
- A fall in cost per Paying Parent is the stronger result for the business.
If you want to see our full approach for education institutions, the digital marketing approach for education institutions page explains every link in this chain.
Limitations
- The results are early-period data from the first 10 days.
- They are the aggregated result of four projects; brand-level performance is not disclosed.
- Raw form and payment counts and budgets are not shared.
- The ratios may change as the period lengthens.
- These results are not a guarantee of outcomes for other institutions.
- Mathematical inferences (e.g. the 48% efficiency figure) are marked explicitly in the text.
Conclusion: Optimize for the Paying Parent, Not the Form
We did not collect cheaper forms. We made it possible for education institutions to reach the point where they actually make money — the Paying Parent — at a lower cost. To someone looking at the dashboard, our cost per form "got worse"; to someone looking at the cash register, the outcome improved markedly. Which report you are reading depends on which question you are asking.
Technical Sources
Frequently Asked Questions
Is a low cost per form always a good thing in education advertising?
What does Paying Parent mean?
How can cost per Paying Parent fall while cost per form rises?
Should education advertising use a Meta instant form or a standalone landing form?
Which conversion event should be sent to Meta?
Are these case results guaranteed for every education institution?
Let us review your advertising, form experience and enrollment process together, as a single chain.